G15b_gganimate
RLT
library(tidyverse)
library(gganimate)
library(rgl)
library(gapminder)
library(ggplot2)
library(animation)
library(gt)
Transiciones graduales
Con la función transition_reveal los datos aparece gradualmente en el gráfico
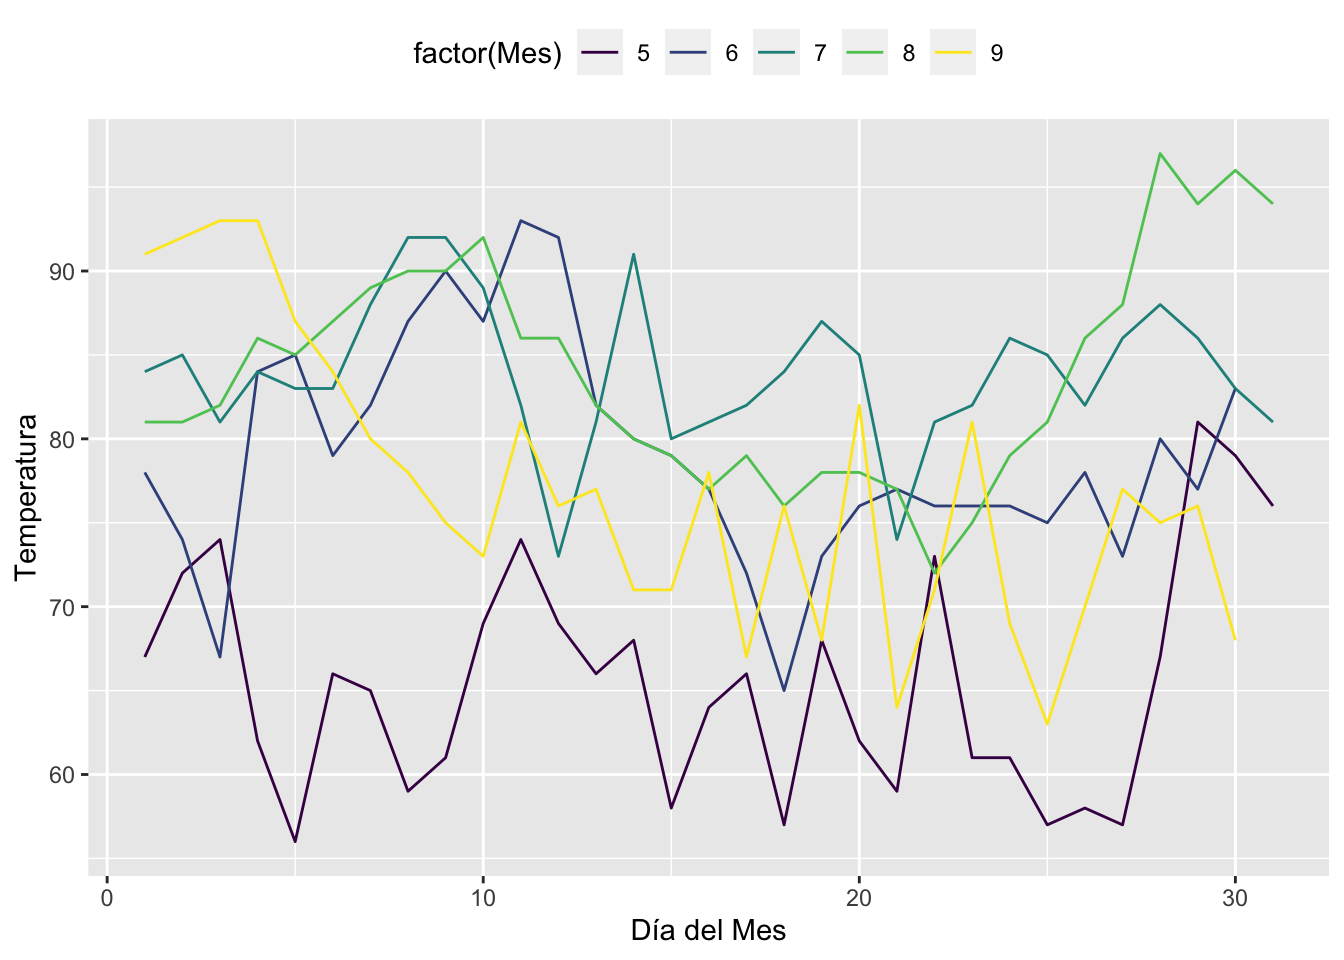
Usamos otro conjunto de datos del archivo airquality que se encuentra en el paquete datasets. Primero creamos un gráfico estático (sin animación), el día del mes (day), la temperatura del día (Temp) y una linea para cada mes (mayo a septiembre) con la función group.
Comenzamos con cambiar el nombre de algunas variables al castellano
names(airquality) # Nombres originales## [1] "Ozone" "Solar.R" "Viento" "Temp" "Mes" "Día"names(airquality)[3] <- 'Viento'
names(airquality)[5] <- 'Mes'
names(airquality)[6] <- 'Día'
#names(airquality) # Nombres en castellano
calidad_aire=airquality
head(calidad_aire)## Ozone Solar.R Viento Temp Mes Día
## 1 41 190 7.4 67 5 1
## 2 36 118 8.0 72 5 2
## 3 12 149 12.6 74 5 3
## 4 18 313 11.5 62 5 4
## 5 NA NA 14.3 56 5 5
## 6 28 NA 14.9 66 5 6t <- ggplot(
calidad_aire,
aes(Día, Temp, group = Mes, color = factor( Mes))) +
geom_line() +
scale_color_viridis_d() +
labs(x = "Día del Mes", y = "Temperatura") +
theme(legend.position = "top")
t
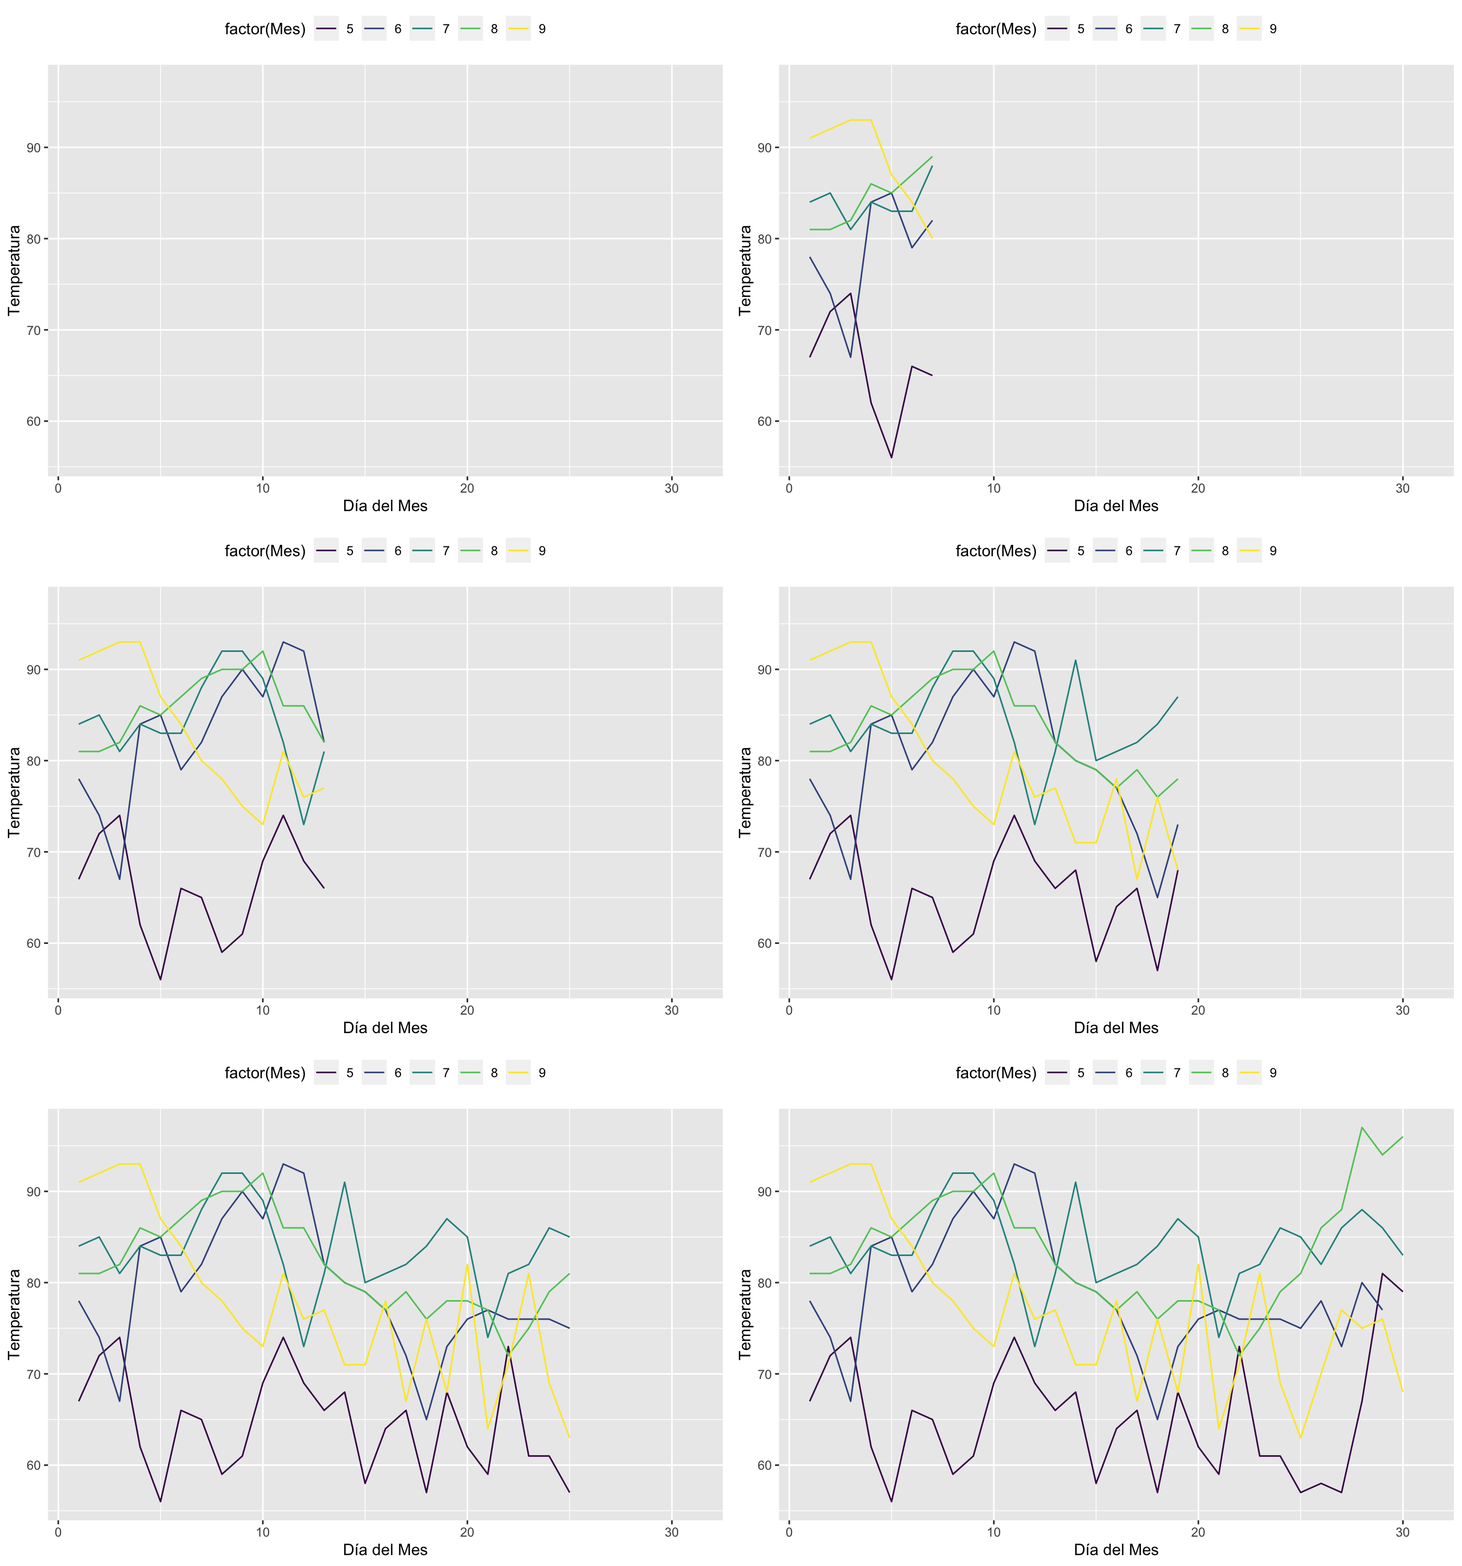
Ahora animamos el gráfico en el eje de x con la variable de Día, añadiendo transition_reveal(Día)
t + transition_reveal( Día)## `geom_line()`: Each group consists of only one observation.
## ℹ Do you need to adjust the group aesthetic?
## `geom_line()`: Each group consists of only one observation.
## ℹ Do you need to adjust the group aesthetic?
Anadiendo un punto a la linea
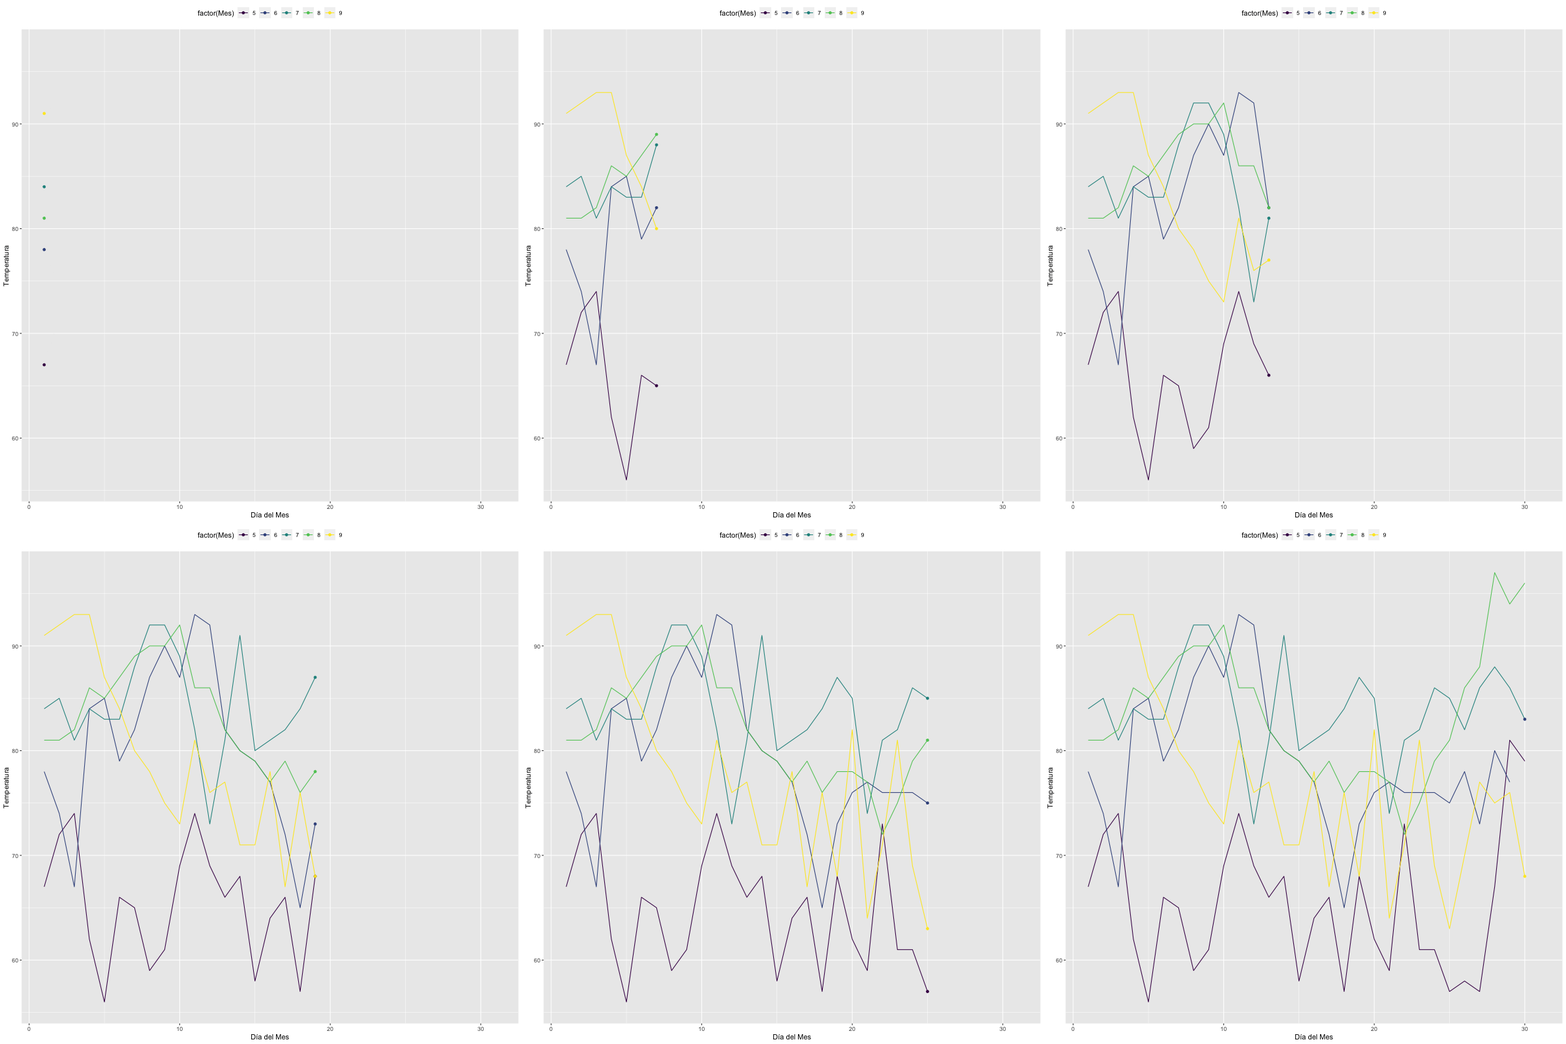
Se puede añadir un punto al principio de las lineas
cambio_m=t +
  geom_point() +
  transition_reveal( Día)
animate(cambio_m, height = 800, width = 800)## `geom_line()`: Each group consists of only one observation.
## ℹ Do you need to adjust the group aesthetic?
## `geom_line()`: Each group consists of only one observation.
## ℹ Do you need to adjust the group aesthetic?
# anim_save("cambio_m.gif")Poniendo un punto para valor
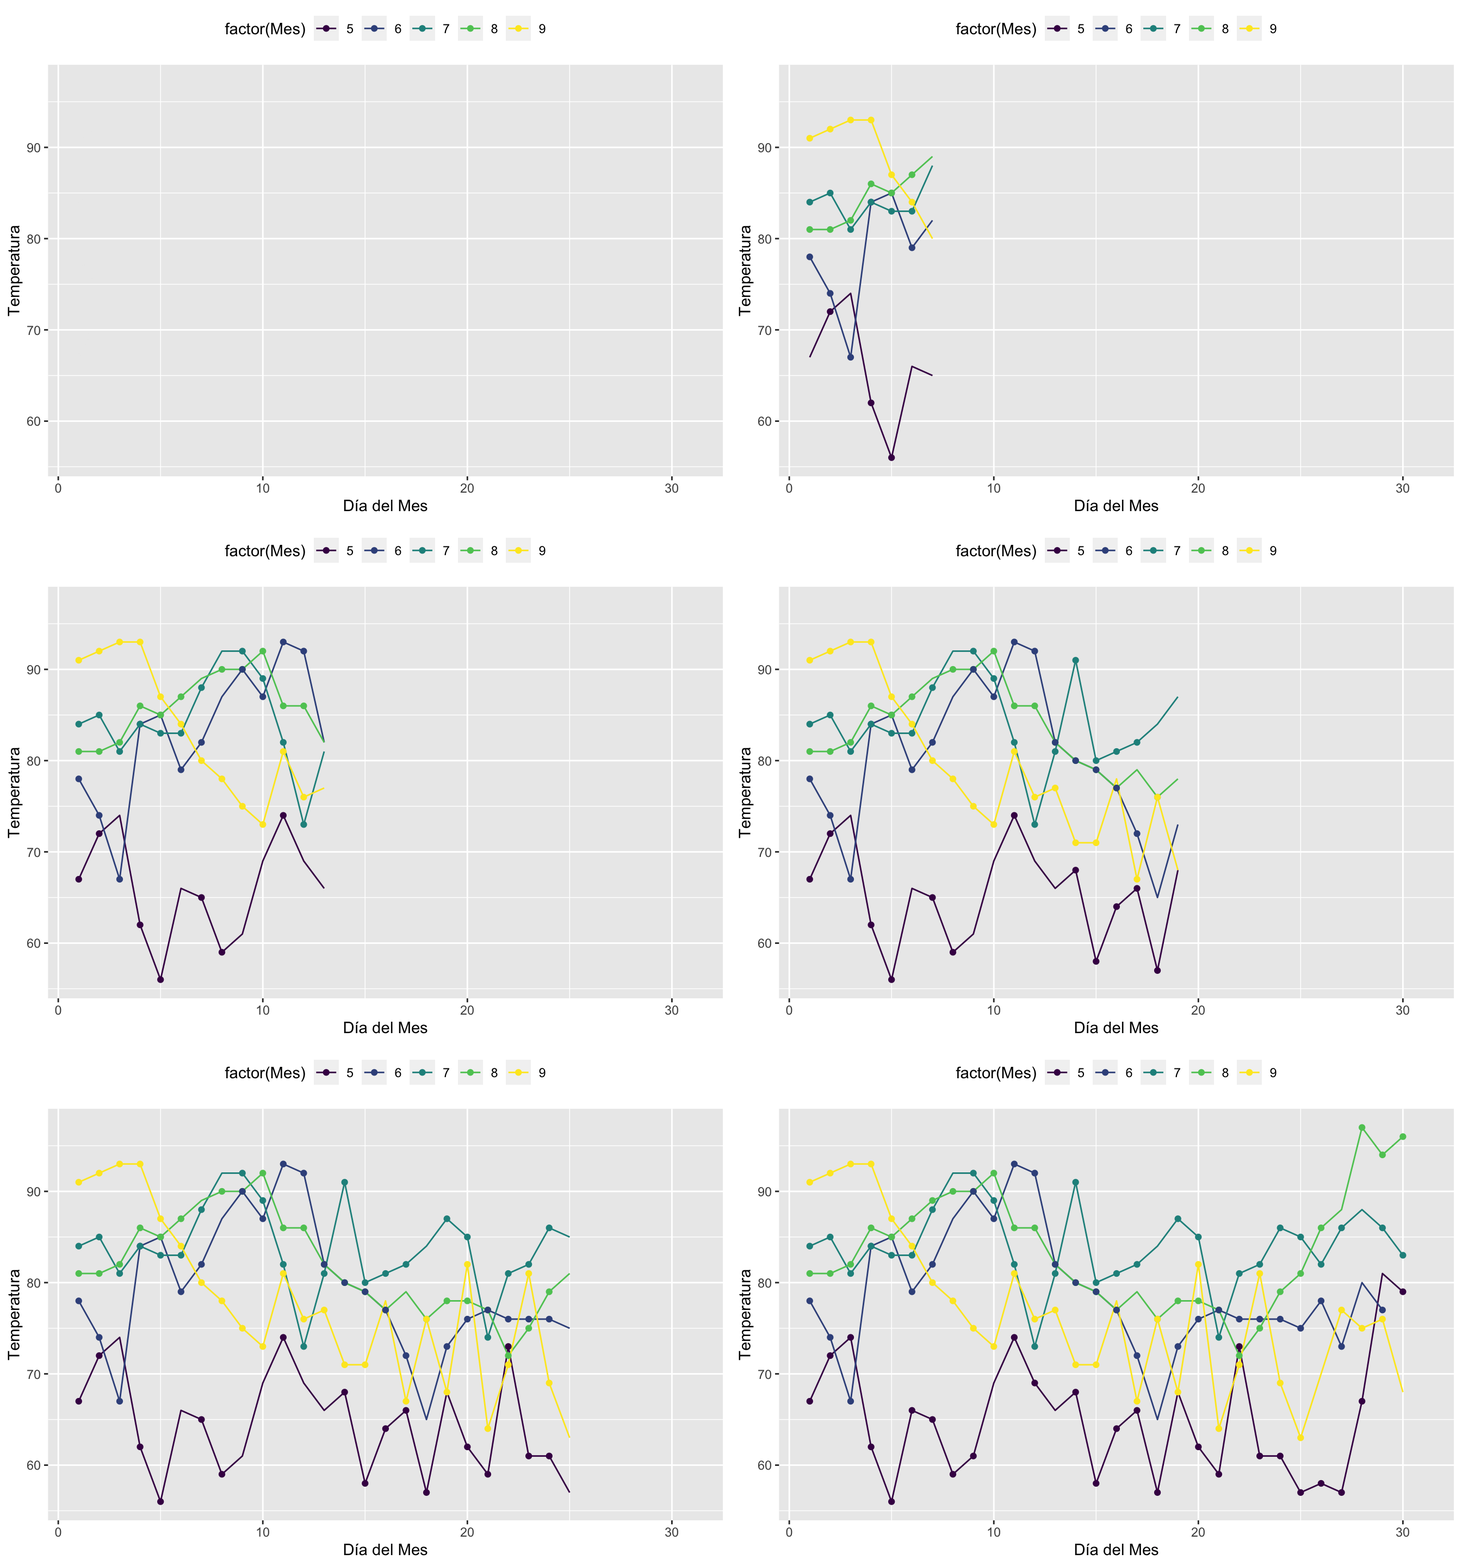
Los puntos se pueden quedar en el gráfico añadiendo (group = seq_along(Día).
t + geom_point(aes(group = seq_along( Día ))) +
  transition_reveal( Día)
## `geom_line()`: Each group consists of only one observation.
## ℹ Do you need to adjust the group aesthetic?
## `geom_line()`: Each group consists of only one observation.
## ℹ Do you need to adjust the group aesthetic?