Ejerc_2_geom_point
This Assignment is to practice doing graphics using geom_point, geom_count.
Q1.
Define what is the difference between geom_point, geom_count. In other words in what situation would you use each of these alternatives.
Q2.
Use the data “Camas_Hospital” in the package ggversa and do a graphic with geom_point which relates the population size of countries and the number of hospital beds.
- The text of the axis should be in 15 pts.
- The text of the axis should be in “bold”.
- The text of the different axis “x” and “y” should be in different colours.
- Change label axis , “x” should be ” Población” and “y” should be “Número de Camas por 100,000”.
Q3.
Use the data “Camas_Hospital” in the package ggversa and do a graphic with geom_point which relates the population size of countries and the number of hospital beds.
- Ahora buscan la función para que el eje de x que sea el logaritmo de los valores en ese eje.
No se olvide cambiar la información en el eje de “X” para que representa la información en log.
Q4.
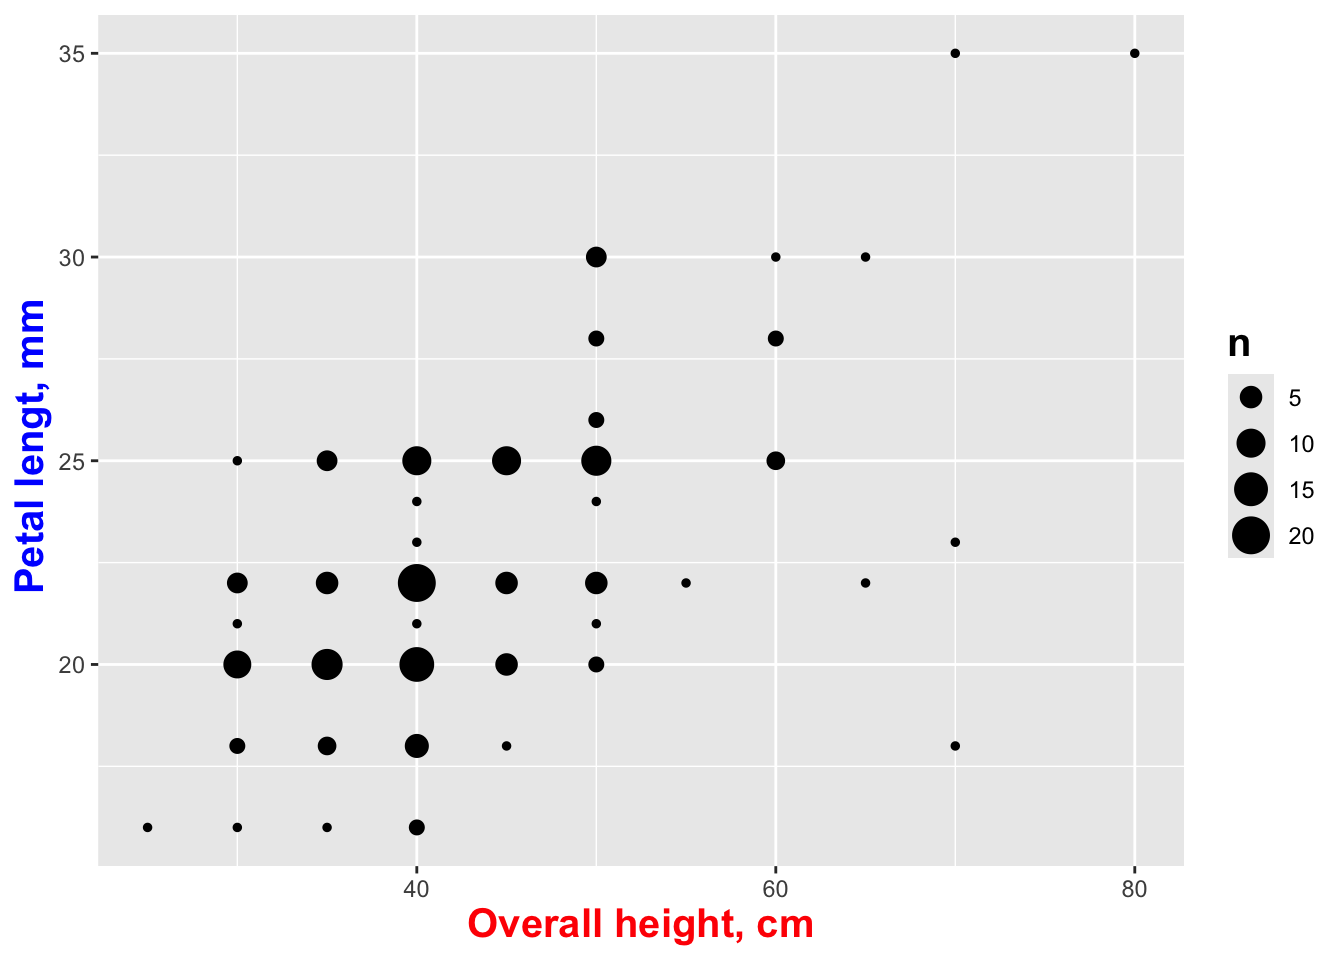
Usando los datos en ggversa, del data set “caladeniavalida”, hacer un gráfico con “geom_count” que relacione la altura total in cm (OH) y la longitud del pétalo en mm (PL).
- El texto de los ejes debe ser de 15 pts.
- El texto de los ejes debe estar en “negrita”.
- El texto de los diferentes ejes “x” y “y” debe estar en diferentes colores.
- Cambiar las etiquetas de los ejes, “x” debe ser “Overall height, cm” y “y” debe ser “Petal length, mm”.
Explica como interpretas el gráfico obtenido.
##
## Attaching package: 'ggversa'
## The following object is masked _by_ '.GlobalEnv':
##
## dipodium## Population Year Plant_num OH OD OW DSL DCL LSL LCL LSW PL LL LW Fruit_not
## 1 Site 1 2008 208 25 30 25 22 5 18 3 3 16 5 5 NA
## 2 Site 1 2004 15 30 35 30 35 6 35 6 4 22 6 6 1
## 3 Site 1 2004 102 30 30 30 25 5 30 5 3 20 5 5 0
## 4 Site 1 2004 118 30 30 30 28 8 30 6 3 21 5 5 0
## 5 Site 1 2004 129 30 30 30 26 5 25 5 3 20 5 6 1
## 6 school 2004 1002 30 40 40 30 10 30 10 4 22 6 6 1## [1] 164 15ggplot(
caladeniavalida ,
aes(OH, PL))+
geom_count()+
xlab("Overall height, cm")+
ylab("Petal lengt, mm ")+
theme(title=element_text(size=15,face="bold"))+
theme(axis.title.x = element_text(colour="red"))+
theme(axis.title.y = element_text(colour="blue"))## Warning: Removed 1 row containing non-finite outside the scale range
## (`stat_sum()`).