G19_Palettas_de_color
Install
##
## Attaching package: 'scales'
## The following object is masked from 'package:purrr':
##
## discard## The following object is masked from 'package:readr':
##
## col_factorEste documento ofrece unos ejemplos de como usar diferentes palettas de color en sus gráficos.
El paquete ggsci
El nombre del paquete es “Scientific Journal and Sci-Fi Themed Color Palettes for ggplot2” y fue escrito por Nan Xiao.
Hay diferentes tipos de palettas ajustado a diferentes revistas científicas.
Palettas principales
American Association for the Advancement of Science
- pal_aaas
- scale_color_aaas
- scale_fill_aaas
## Warning: This manual palette can handle a maximum of 10 values. You have supplied
## 15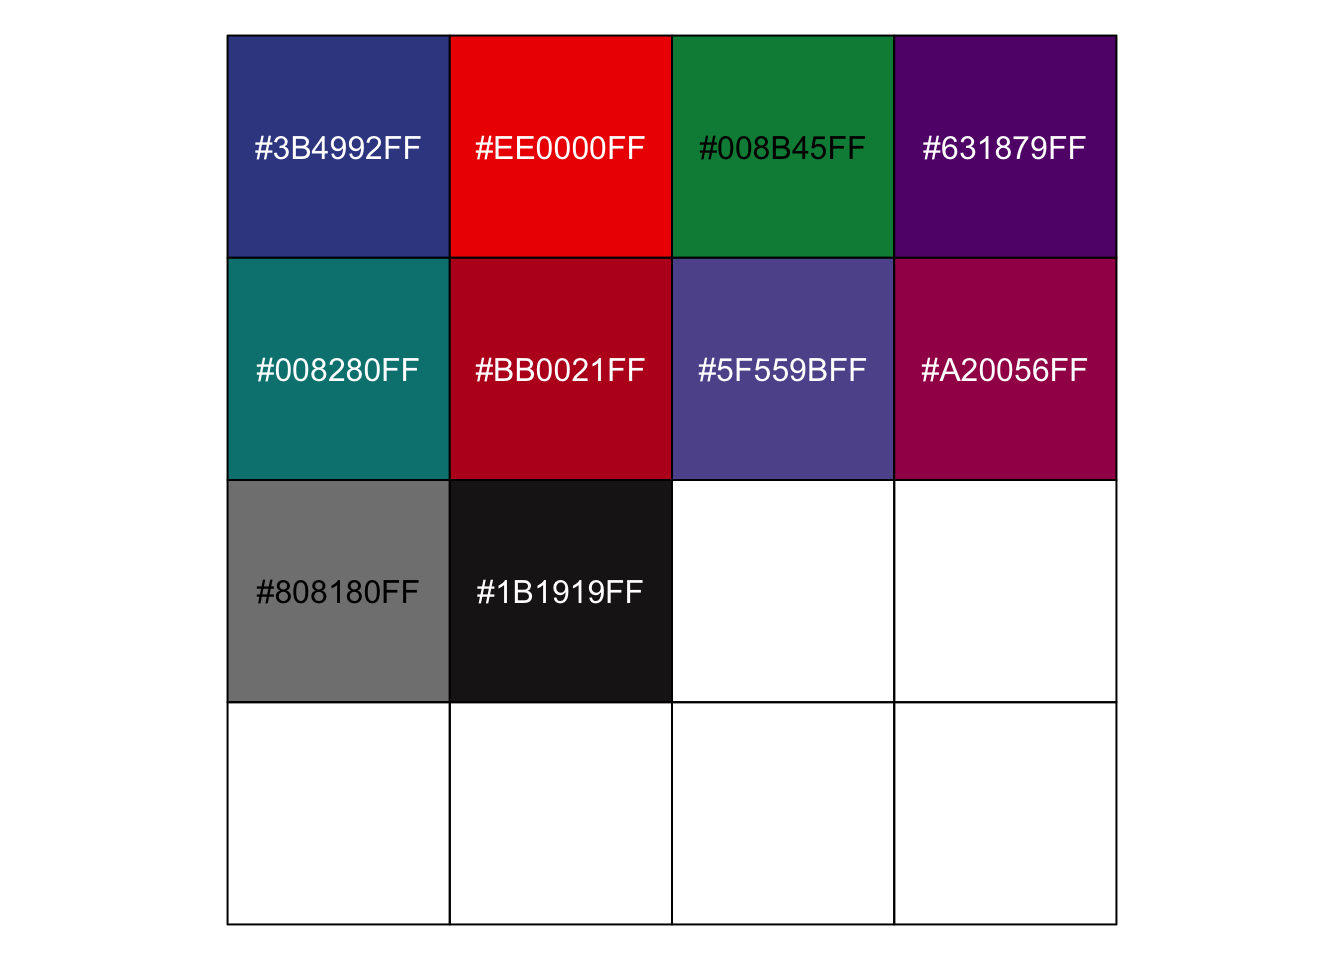
Catalogue of Somatic Mutations in Cancer (COSMIC)
- pal_cosmic
- scale_color_cosmic
- scale_fill_cosmic
library("scales")

#  Color palettes = "hallmarks_light", "hallmarks_dark", "signature_substitutions"
show_col(pal_cosmic("hallmarks_dark")(10))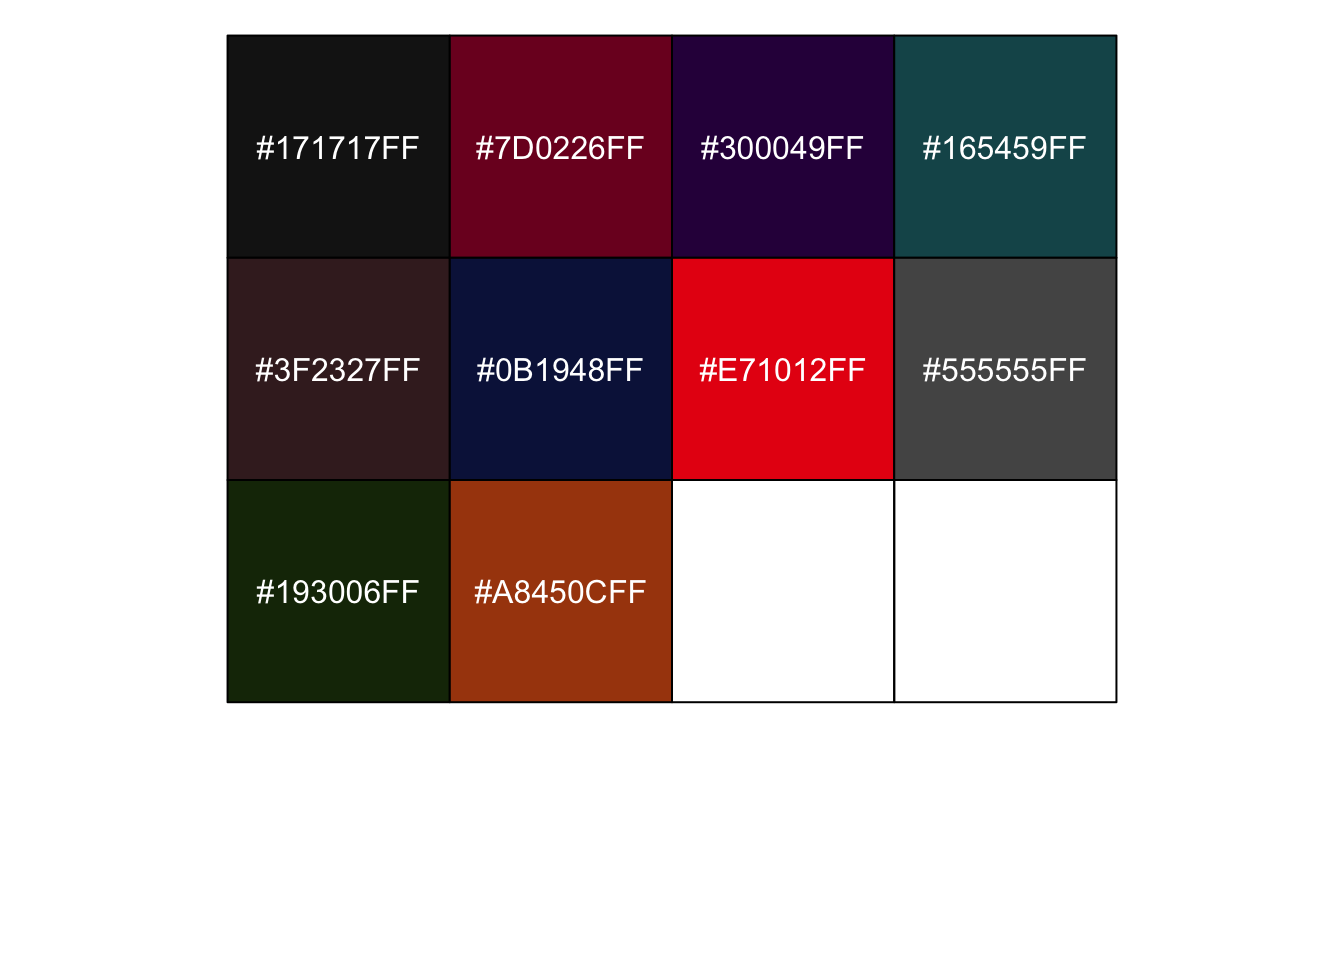
Usar la paletta de “hallmarks_dark” en un gráfico con diamonds
ggplot(diamonds, aes(x = cut, fill = cut))+
  geom_bar() +
  scale_fill_cosmic(palette = "hallmarks_dark") +
  theme(legend.position = "none")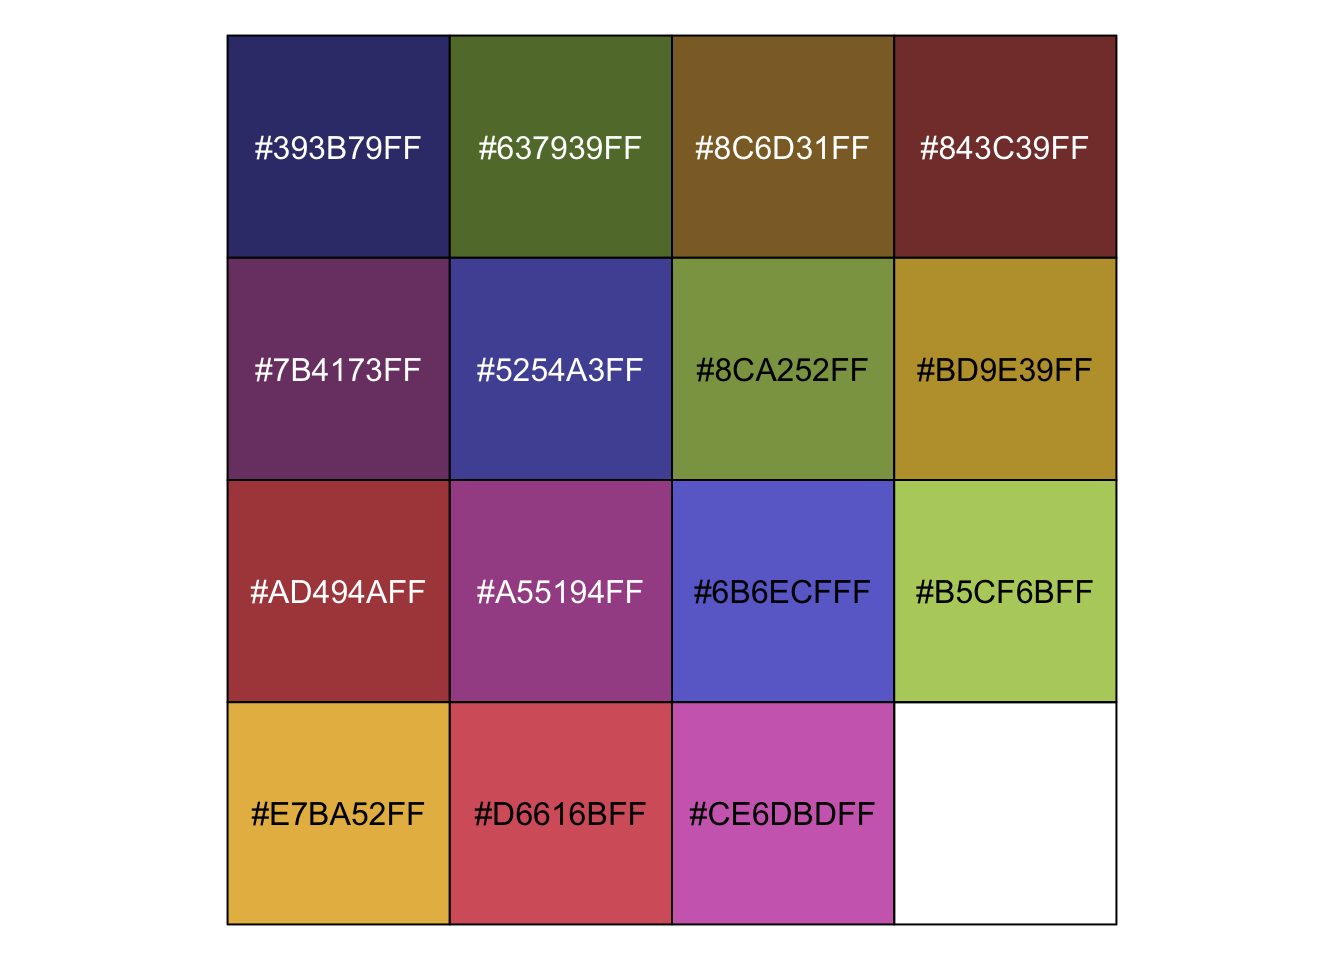

Diferentes opciones
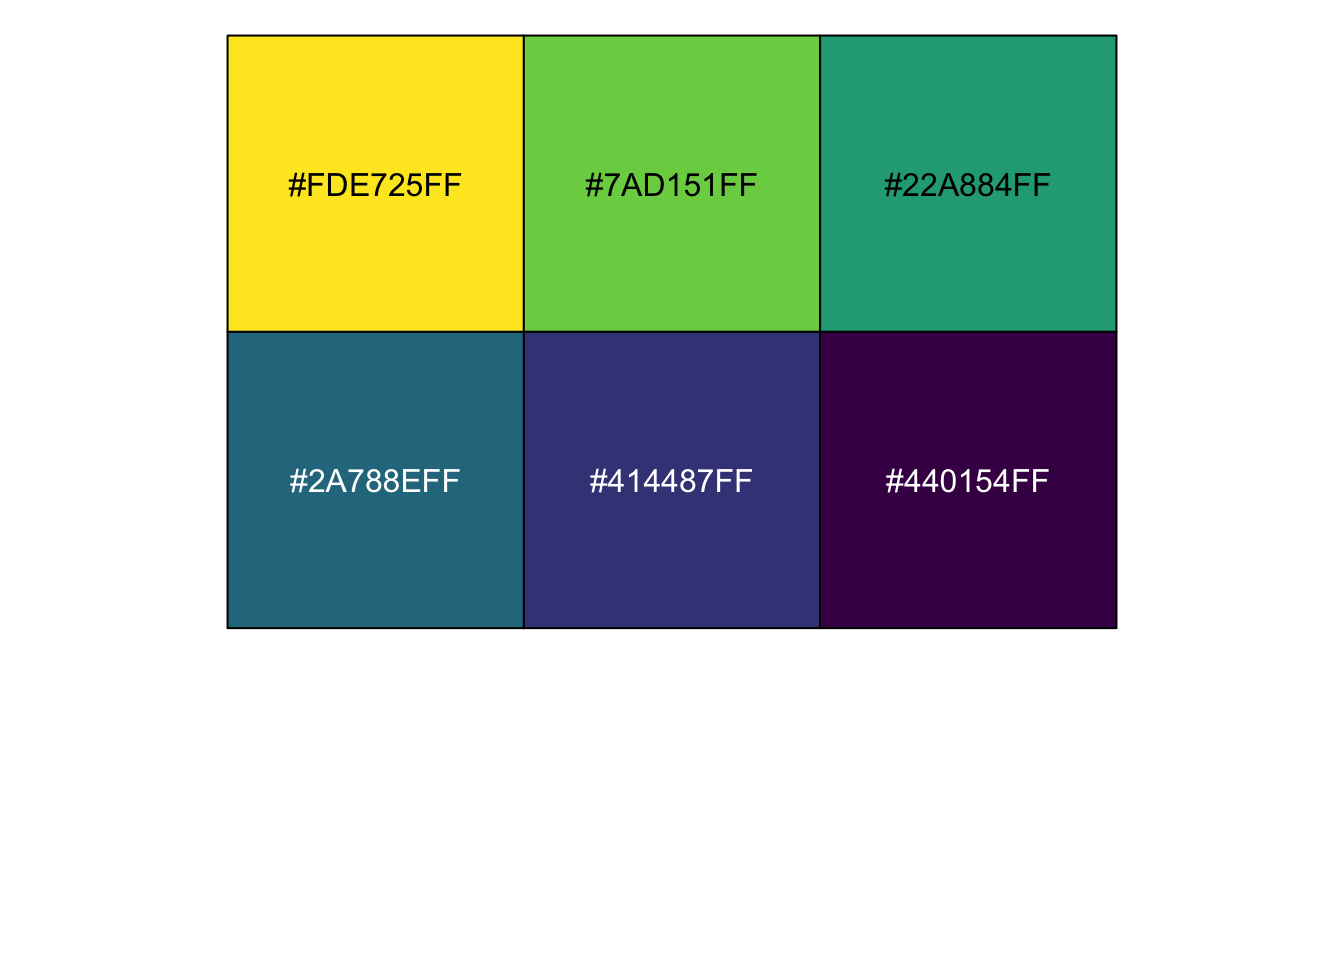
“magma” (or “A”)
“inferno” (or “B”)
“plasma” (or “C”)
“viridis” (or “D”)
“cividis” (or “E”)
“rocket” (or “F”)
“mako” (or “G”)
“turbo” (or “H”)
Reference:
D3.js Color Palettes
- pal_d3
- scale_color_d3
- scale_fill_d3
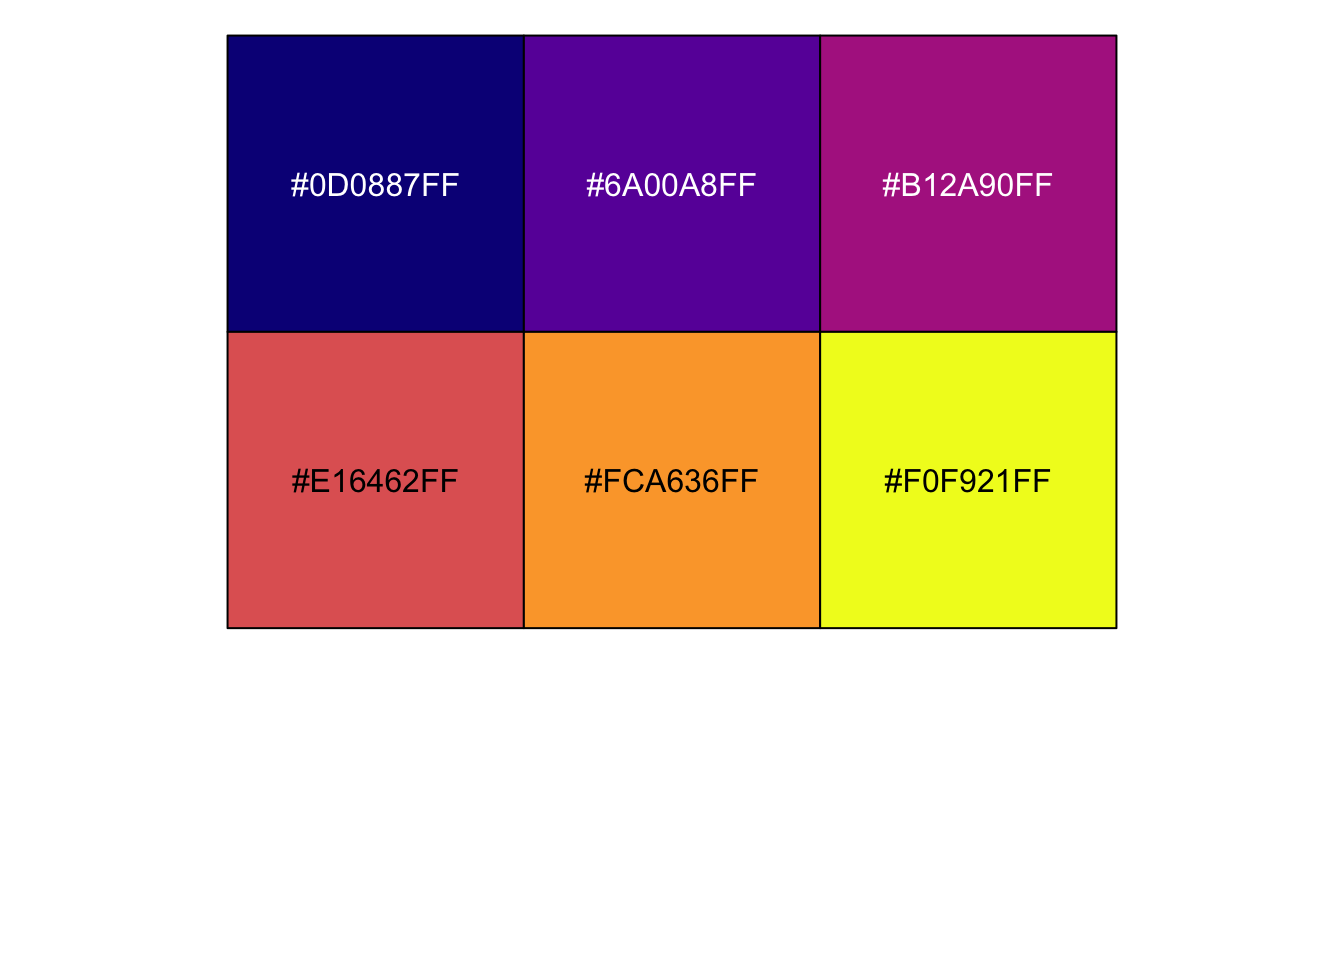
library(ggsci) # Scientific journal and Sci-fi themed color palettes for ggplot2
# colour_palettes= "category10", "category20", "category20b", "category20c"
show_col(pal_d3("category20c")(15))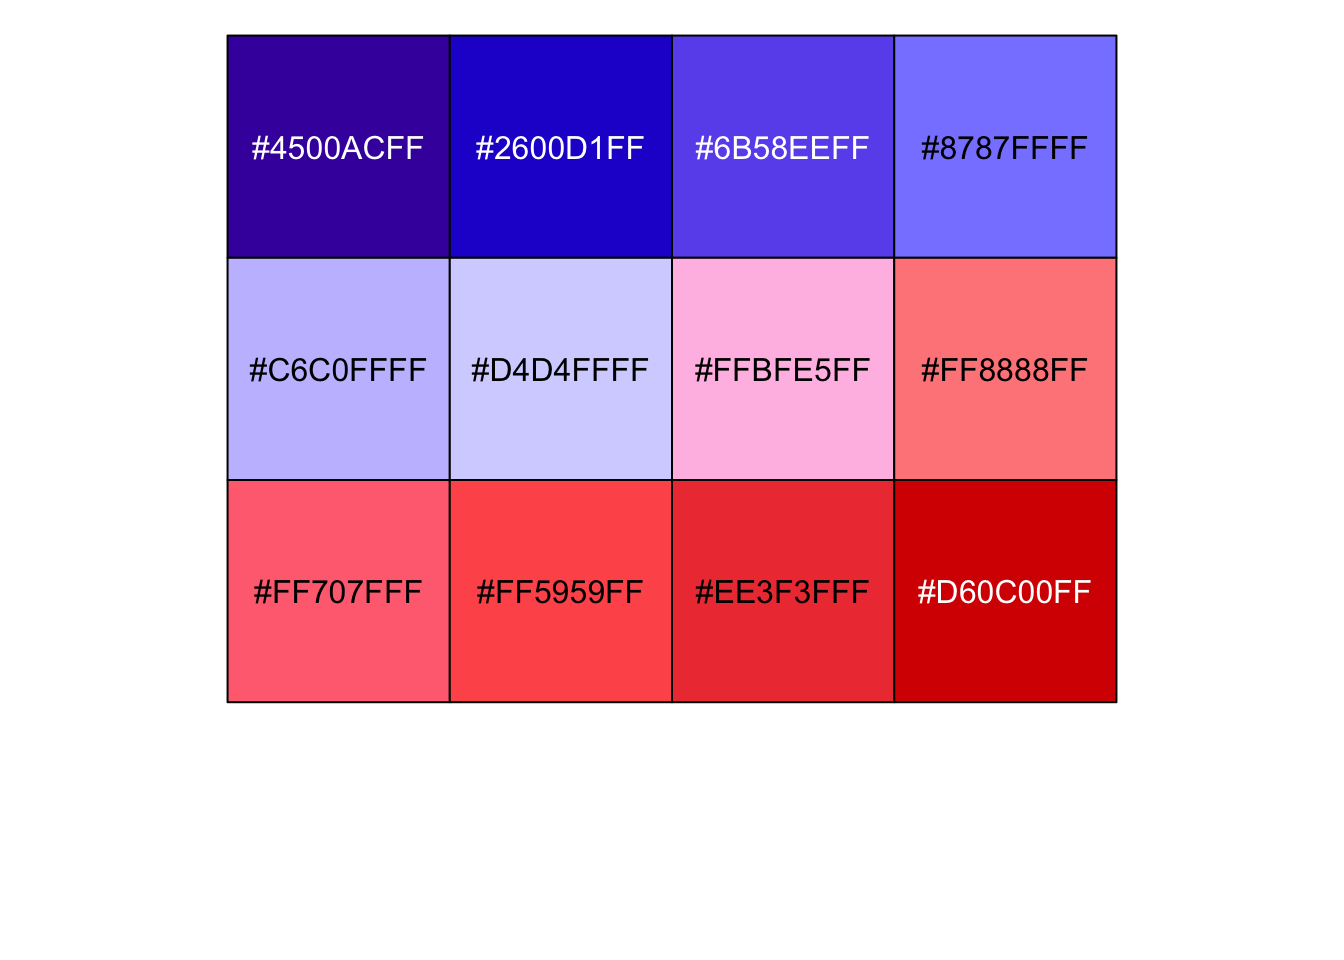
USar la paletta de “category20b” en un gráfico con diamonds
ggplot(diamonds, aes(x = carat, y=price, colour=cut))+
  geom_point() +
  scale_colour_d3(palette = "category20b") +
  theme(legend.position = "none")+
  facet_wrap(~cut)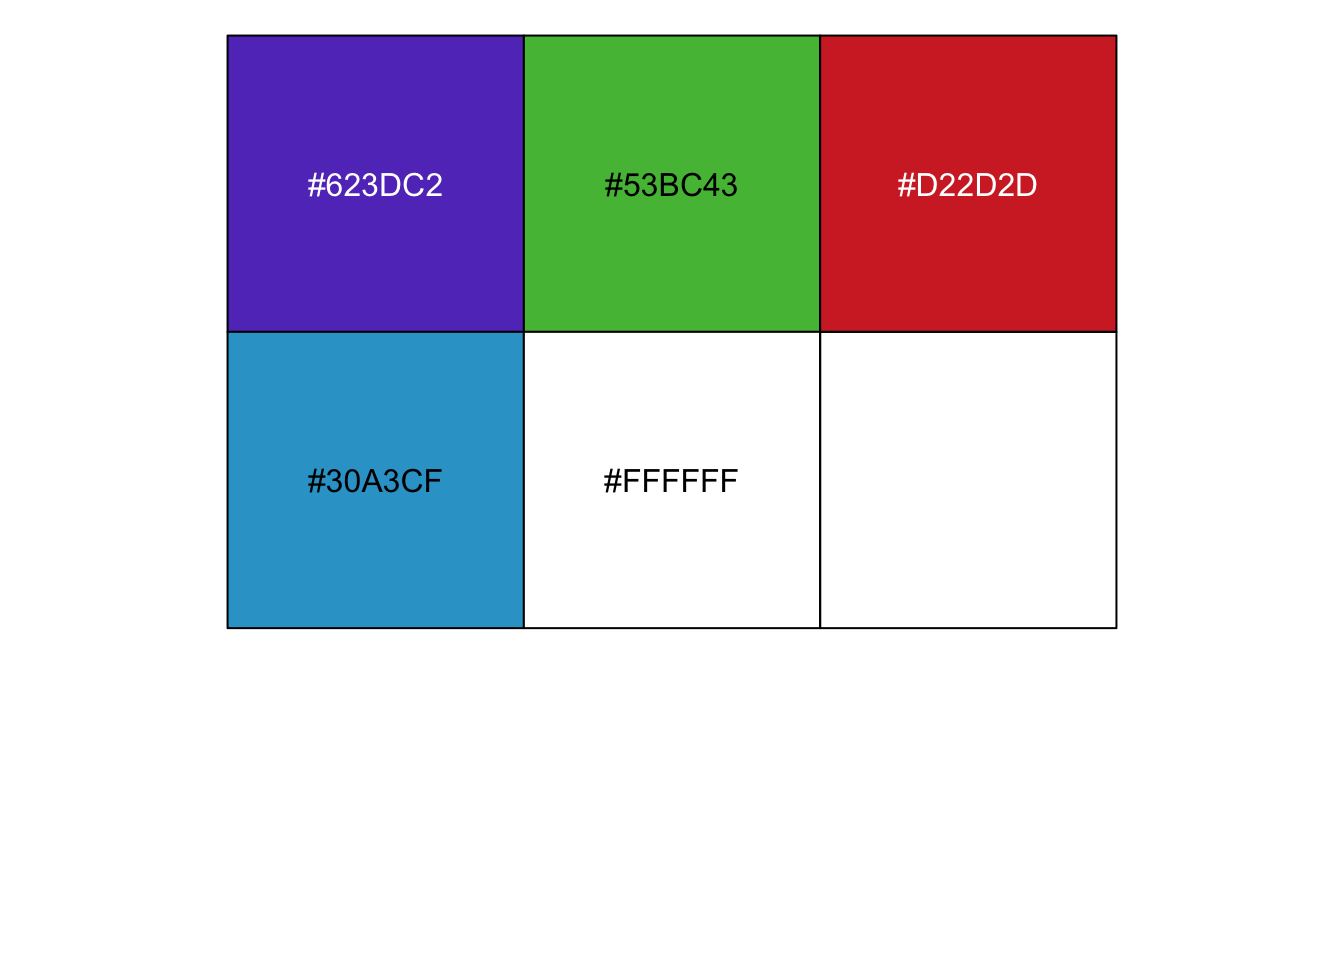
Paletta de Jama = Journal of the American Medical Association

Paletta de Lancet = The Lancet
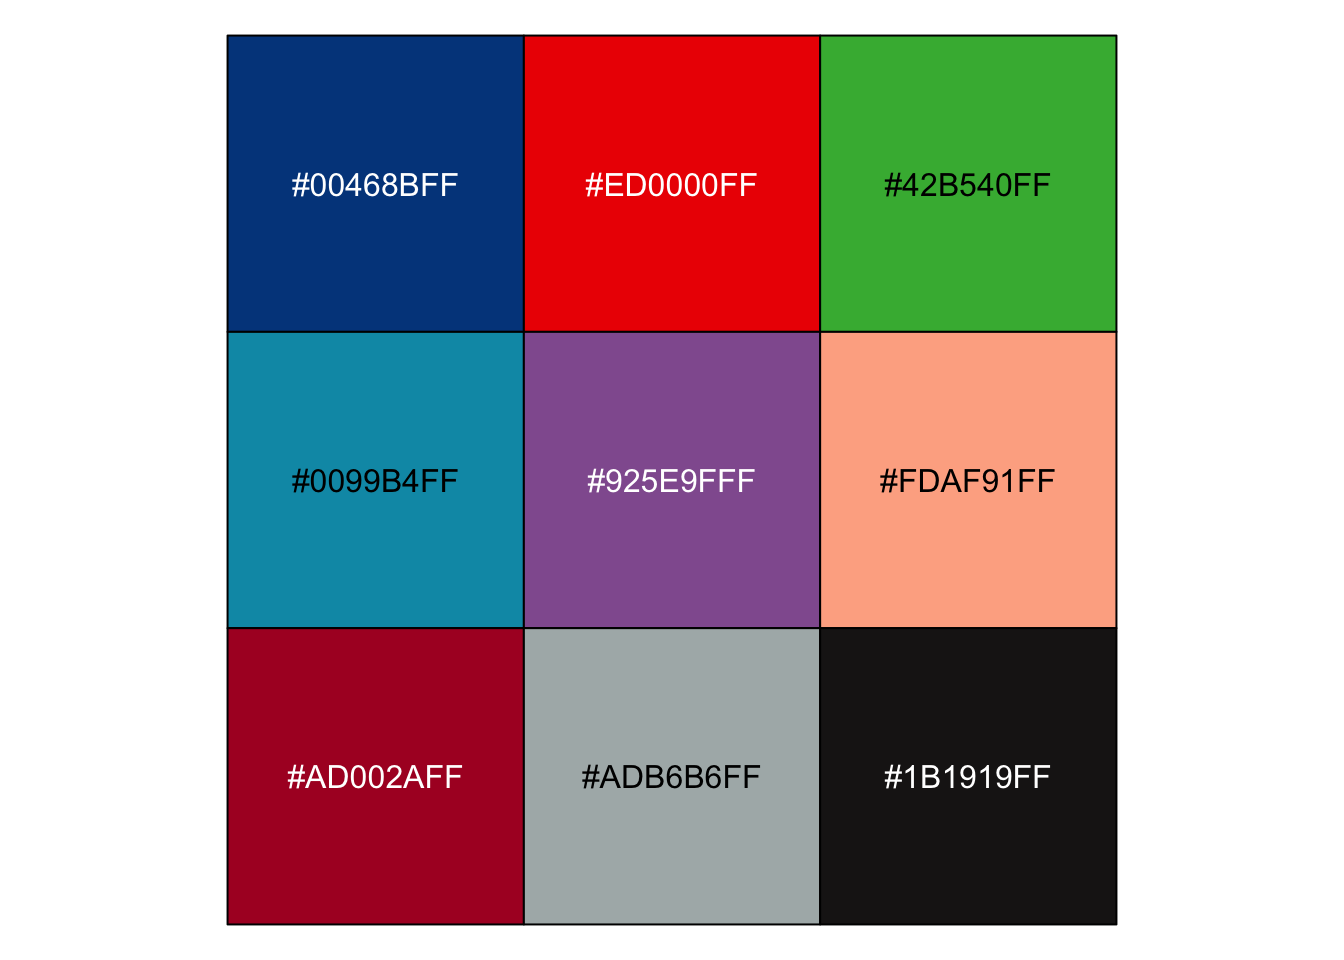
Usar la paletta de “lanonc” en un gráfico con diamonds
ggplot(diamonds, aes(x = cut, fill = cut))+
  geom_bar() +
  scale_fill_lancet(palette = "lanonc") +
  theme(legend.position = "none")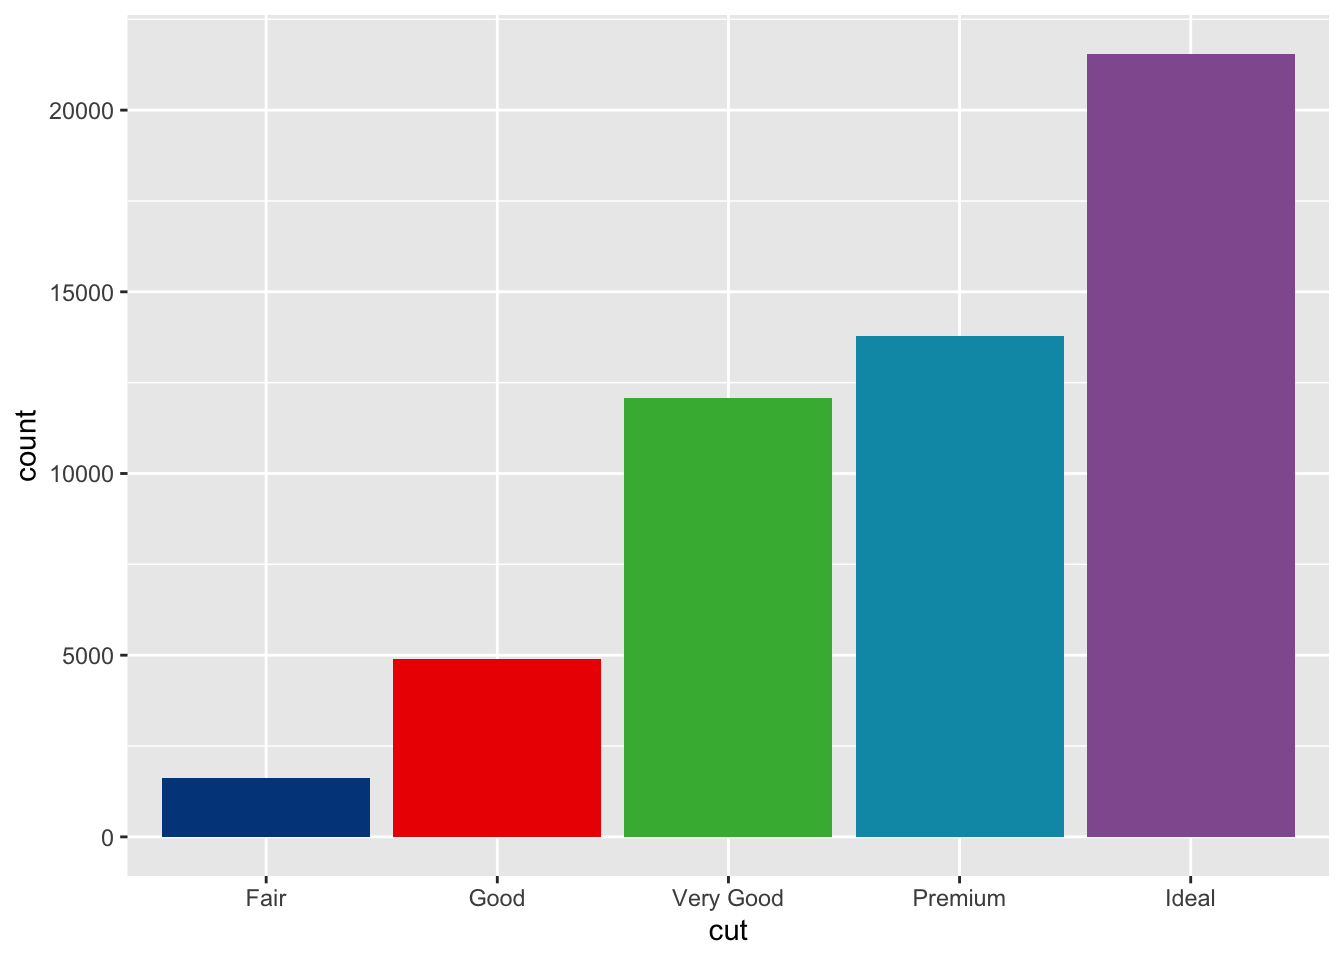
Paletta de los journals de Fonrtiers. = Frontiers in Neuroscience, Frontiers in Microbiology, Frontiers in Psychology, etc.
scale_color_frontiers(palette = c(“default”), alpha = 1, …)
scale_colour_frontiers(palette = c(“default”), alpha = 1, …)
scale_fill_frontiers(palette = c(“default”), alpha = 1, …)
Frontiers Color Palettes
- pal_frontiers
- scale_color_frontiers
- scale_fill_frontiers

library("ggplot2")
data("diamonds")

ggplot(
  subset(diamonds, carat >= 2.2),
  aes(x = table, y = price, colour = cut)
) +
  geom_point(alpha = 0.7) +
  geom_smooth(method = "loess", alpha = 0.1, size = 1, span = 1) +
  #theme_dark() +
  #theme(
  #  panel.background = element_rect(fill = "#2D2D2D"),
  #  legend.key = element_rect(fill = "#2D2D2D")
  #) +
  scale_color_frontiers()
## `geom_smooth()` using formula = 'y ~ x'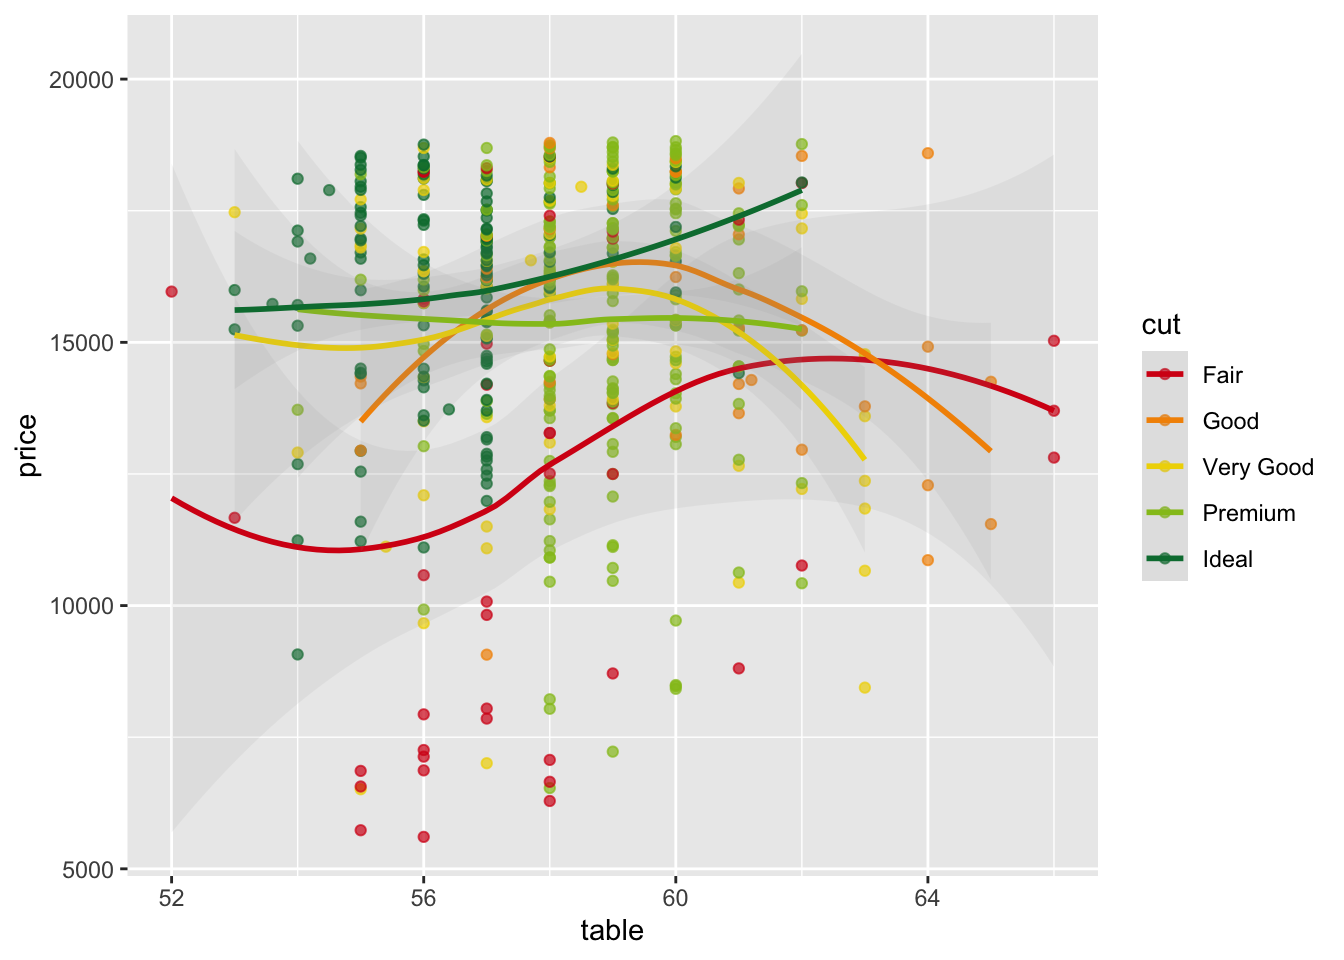
ggplot(
  subset(diamonds, carat > 2.2 & depth > 55 & depth < 70),
  aes(x = depth, fill = cut)
) +
  geom_histogram(colour = "black", binwidth = 1, position = "dodge") +
  theme_dark() +
  theme(
    panel.background = element_rect(fill = "#2D2D2D")
  ) +
  scale_fill_frontiers()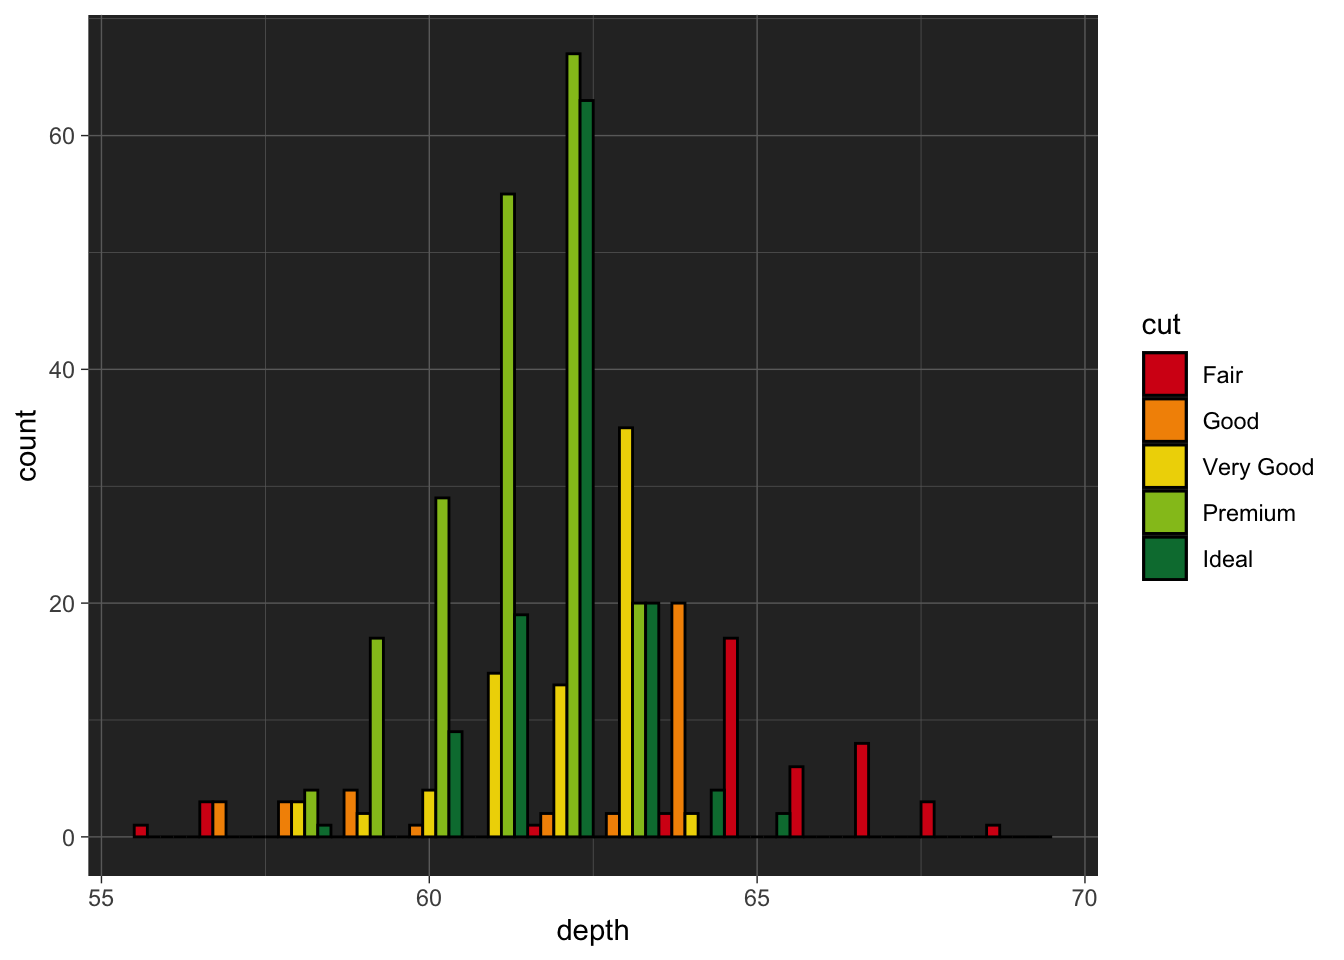
Paletta de los Simpsons
ggplot(
  subset(diamonds, carat >= 2.2),
  aes(x = table, y = price, colour = cut)
) +
  geom_point(alpha = 0.7) +
  geom_smooth(method = "loess", alpha = 0.1, size = 1, span = 1) +
  theme_bw() +
  scale_color_simpsons()
## `geom_smooth()` using formula = 'y ~ x'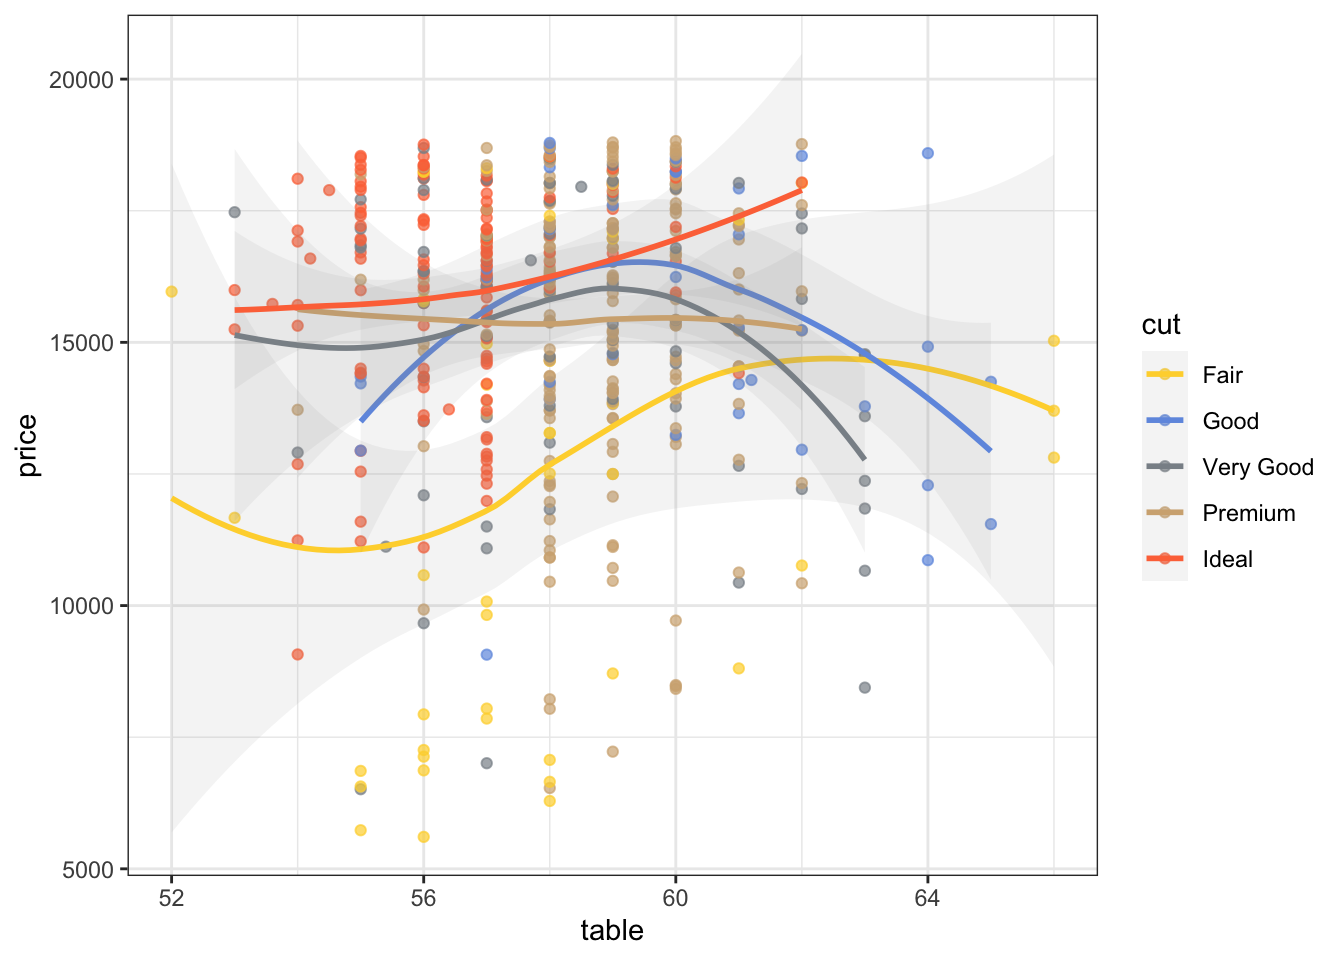
- Reference:
https://github.com/d3/d3-3.x-api-reference/blob/master/Ordinal-Scales.md
Frontiers Color Palettes
- pal_frontiers
- scale_color_frontiers
- scale_fill_frontiers
GSEA Gene Pattern Color Palettes
- pal_gsea
- scale_color_gsea
- scale_fill_gsea

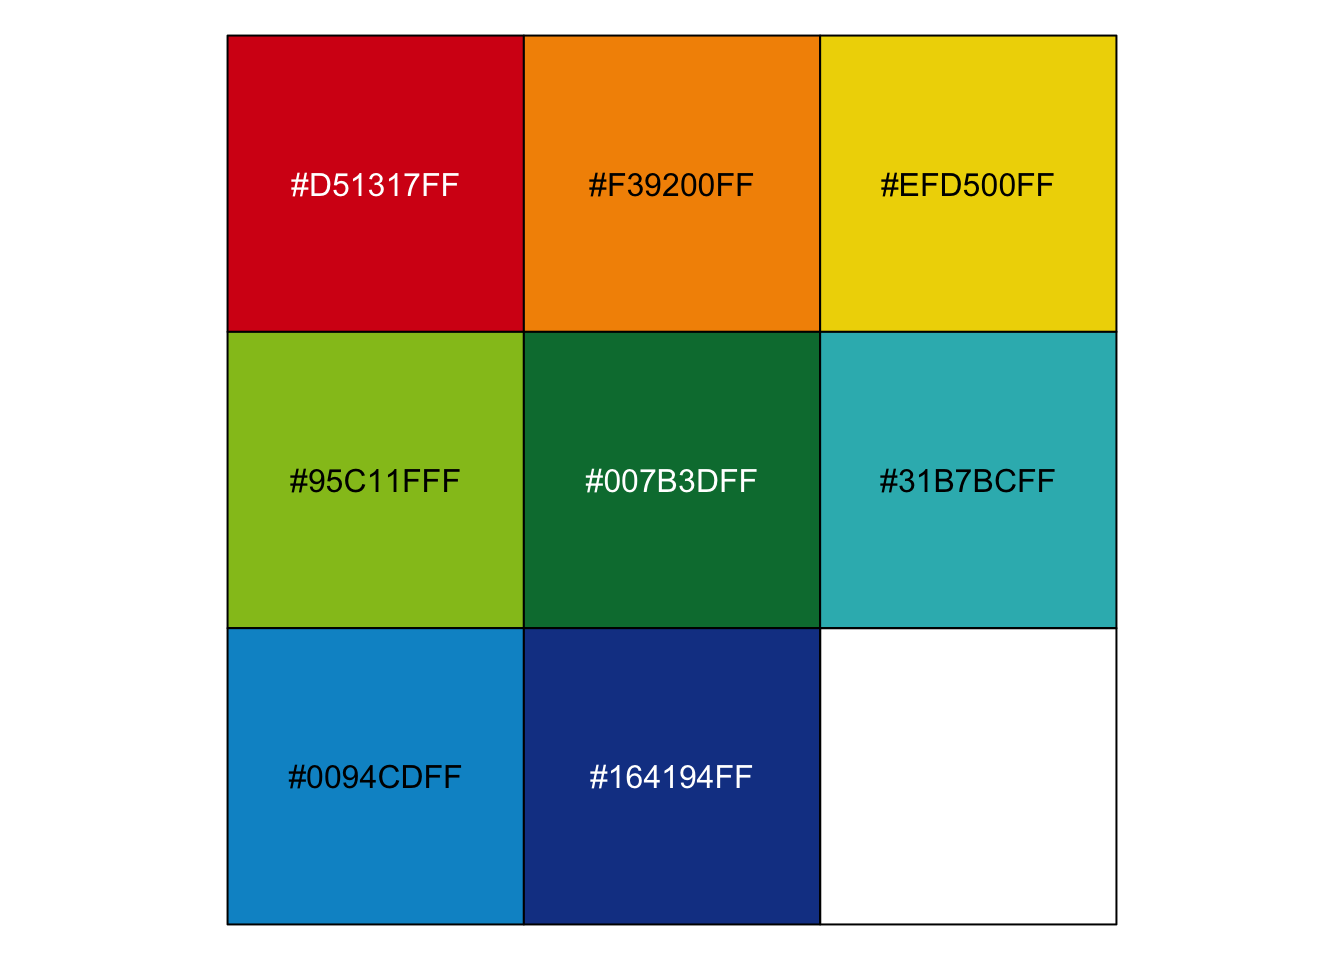
Crear su propia Paletta
Puedes crear tu propia palettas usando los códigos de los colores, por ejemplo usando este enlace
Crear una paletta sencilla
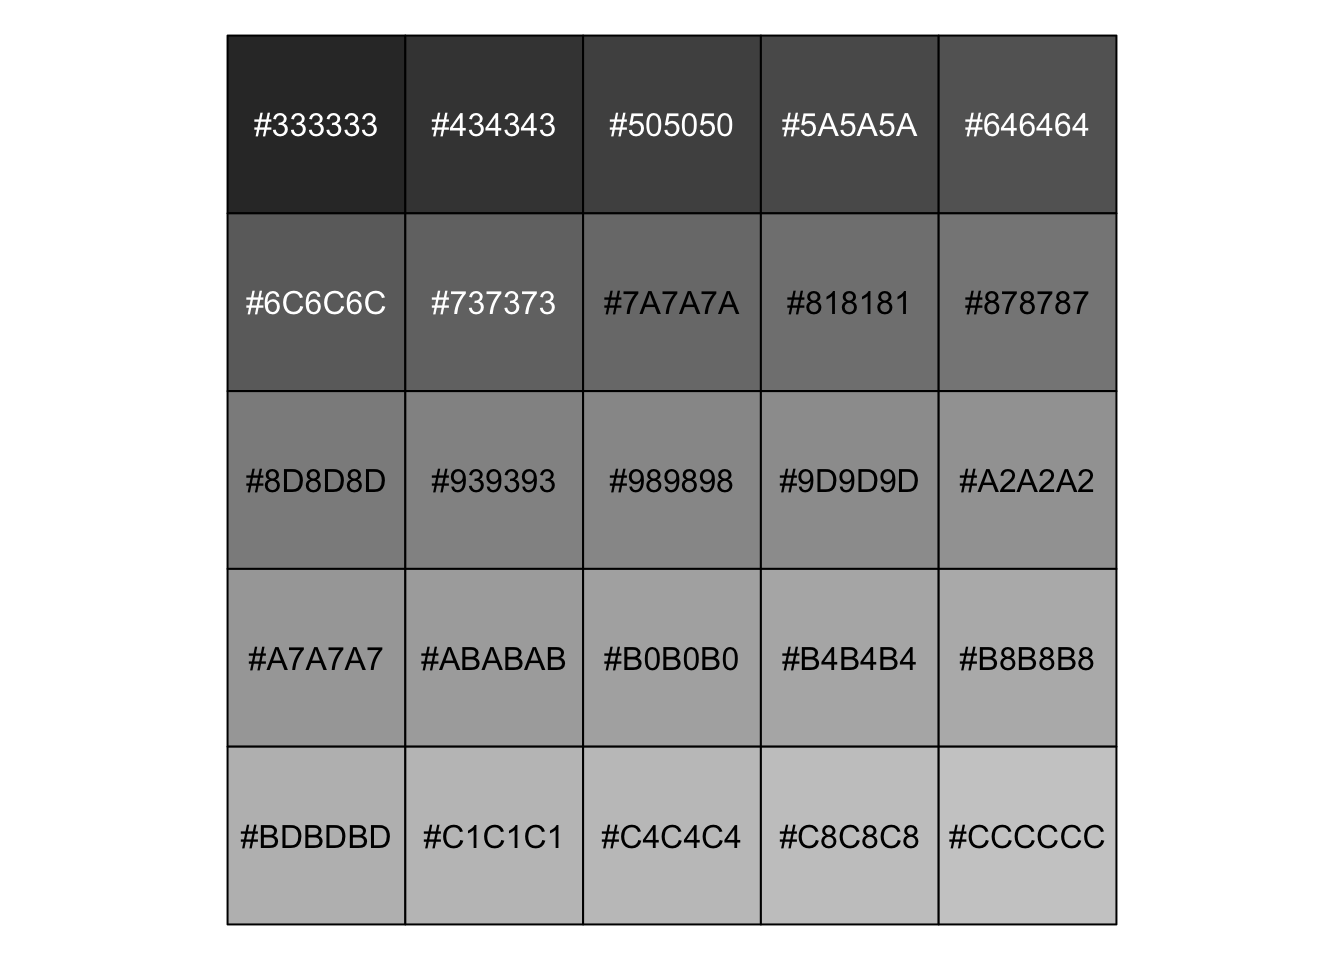
miscolores <- colorRampPalette(
  colors =c("#623dc2", "#53bc43", "#d22d2d",
            "#30a3cf","#37c8c1" ))(5)
# nota el valor al final es cuant colores tiene en su paletta.

miscolores
## [1] "#623DC2" "#53BC43" "#D22D2D" "#30A3CF" "#37C8C1"
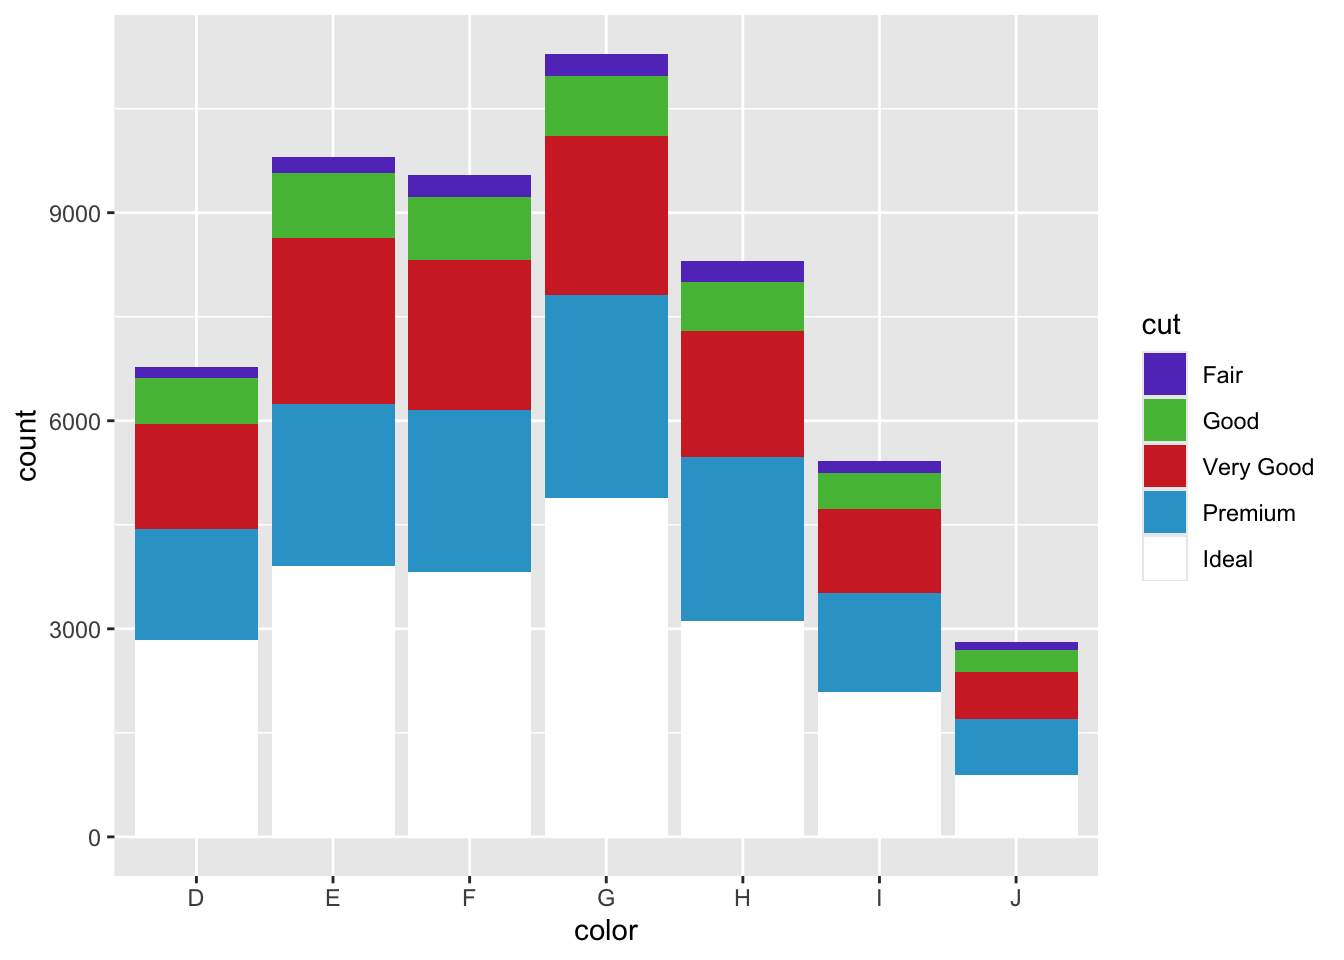
Ahora usarlos en una gráfica
library(ggplot2)
data(diamonds)

ggplot(diamonds, aes(x = color, fill = cut)) +
  geom_bar() +
  scale_fill_manual(values = miscolores)